
China GDP in 2021 reached US$17.7 trillion (RMB114.4 trillion), showing an increase of approx. US$3 trillion (RMB 13 trillion) compared to 2020, and 8.1 percent growth year-on-year, according to the National Bureau of Statistics (NBS).
Table of Contents
China authorities have also unveiled data tracking the economic performance of 31 provinces, autonomous regions, and municipalities directly under the Central Government for 2021. With global headwinds and Covid-linked uncertainties dampening China’s economic growth outlook in 2022, it is easy to feel pessimistic. That’s why we take a closer look at the growth rates of prominent provinces and major cities in China in this article – to gain sense of what is happening on the ground and whether the country continues to be a favored investment destination.
Guangdong’s GDP ranked first for the 33rd consecutive year
In 2021, the China GDP economic output of many provinces reached a new high. Among others, Guangdong’s GDP exceeded RMB 12 trillion for the first time – reaching RMB 12.44 trillion (approx. US$1.92 trillion) and registering eight percent growth year-on-year. This ensures that Guangdong ranked first in the country for the 33rd consecutive year. To compare, based on 2020 statistics, Guangdong’s GDP was higher than Italy (US$1.89 trillion), Canada (US$1.64 trillion), and South Korea (US$1.64 trillion).
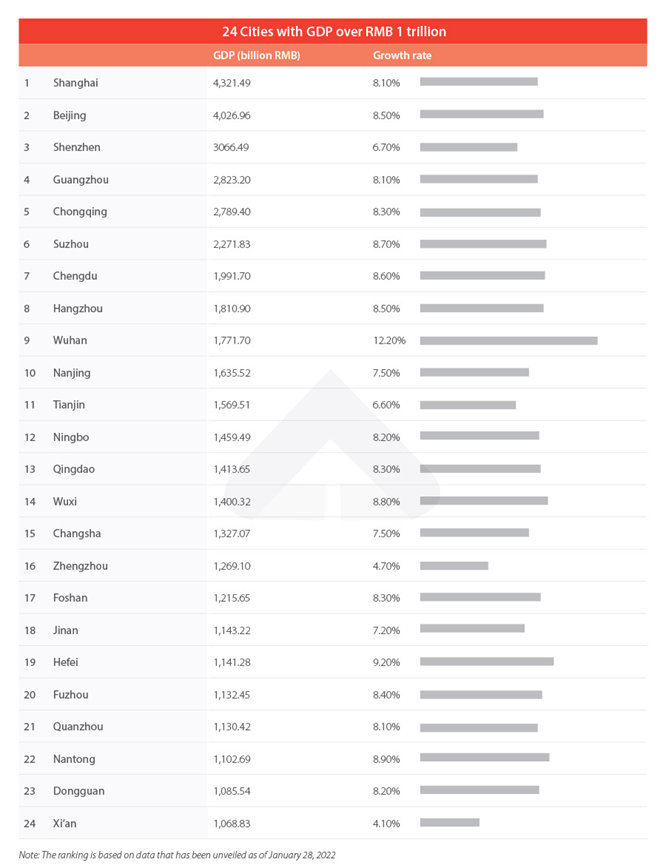
24 cities with China GDP over RMB 1 trillion
In 2021, China’s city GDP “trillion club” expanded again as 24 cities ended up with a GDP over RMB 1 trillion (approx. US$0.16 trillion).
Shanghai and Beijing’s GDP exceeded RMB 4 trillion (approx. US$0.62 trillion). The rapid recovery of Shanghai’s economic growth owes much to strategic emerging industries, especially new energy vehicles. Beijing’s rapid growth is partly due to the fast growth of its industries above the designated size. On the other hand, Beijing has begun to deploy advantageous production capacity after relocating the non-capital functions to neighboring provinces.
Dongguan’s GDP reached RMB 1.09 trillion (approx. US$0.17 trillion) in 2021, becoming the 24th member of the trillion-club cities. According to analysts, this is mostly due to the rapid growth of China foreign trade in 2021.
In terms of the geographic area of the 24 trillion club cities, 18 of them were located in South China while six of them belonged to North China. In terms of their constituent provinces, the number of trillion-club cities in Guangdong reached four, including Shenzhen, Guangzhou, Foshan, and Dongguan. Thus, Guangdong has caught up with Jiangsu in the number of trillion-club cities. Jiangsu has the following four trillion-club cities: Suzhou, Nanjing, Wuxi, and Nantong.
List of top municipalities and prefecture-level divisions by GDP[1]
Nominal China GDP is based on the official annual average exchange rate at CN¥ 6.8974 per US dollar in 2020;[2]
CN¥4.2082 per Int’l. dollar (according to World Economic Outlook published by IMF on April 2021 publication)[3]
Though GDP numbers only tell part of the story of a region’s economic situation, it is an important indicator for managing growth expectations and predicting local economic policies. Enterprises doing business in China should keep a close eye on the economic development patterns of specific provinces and cities.